")
In previous blogs we highlighted the utility of an exposure response (E-R) analysis to demonstrate efficacy. In an E-R analysis the relationship between the amount of drug exposure (typically area under concentration-time curve or AUC) and the treatment effect is evaluated. The AUC can be calculated once the Pharmacokinetic (PK) parameters of rate constant for absorption (Ka), volume of distribution (Vd), and clearance (Cl) are known. In a patient population, blood sampling is infrequent (sparse), when compared to the frequent sampling in healthy volunteers. In such instances, a population PK (PPK) approach is used to derive PK parameters for the patient. The best PPK model is one which gives values for the measures of central tendency (mean, median or mode) and the variability (inter-individual, inter-occasion and residual variability).
There are several approaches to PPK modelling. In the Naïve Pooling approach, all data points (plasma concentrations) are assumed to arise from a single individual. For the Average Fitting approach, all data points have to be collected at the same time after study drug. The data points are averaged, the average concentration plotted against time and the PK parameters calculated from this. With naïve and average fitting we only get the central tendency (mean, median or mode) not the variability. In the Standard Two Stage, the model is identified separately in all subjects (e.g. with least squares), obtaining individual estimates of the parameters. From this, the population mean and covariance are calculated as the sample mean and covariance. However, as the sampling is infrequent the precision of the individual PK parameters is compromised. In the Iterative Two Stage, the mean and variance are taken as starting values and the parameters are re-estimated. The cycle is repeated until the estimate for the population mean and variance do not change any more. It gives a more reliable individual estimate.
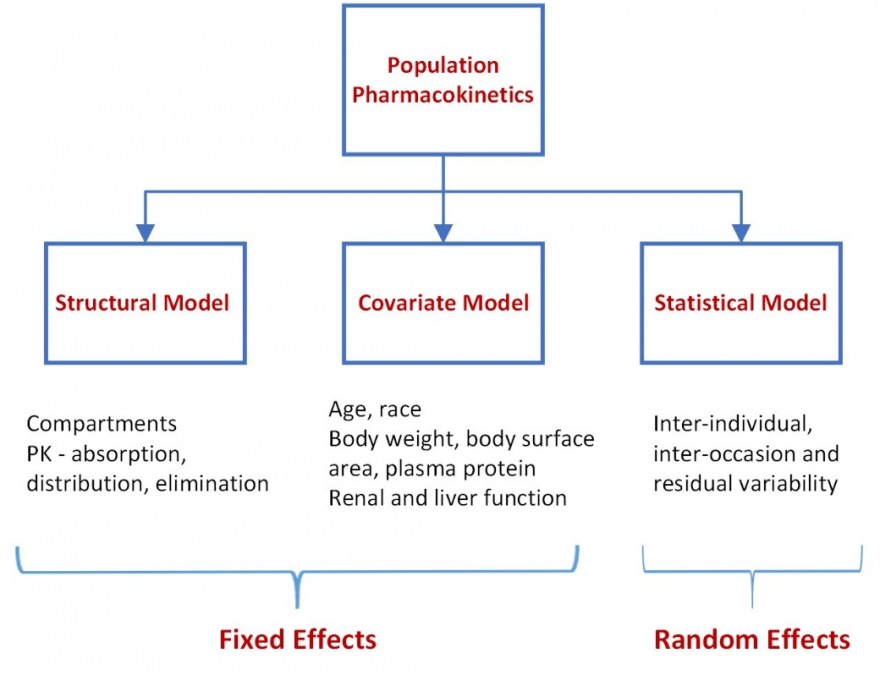
Non-linear mixed effects (fixed and random effects) modelling (NONMEM) introduces statistical modelling between the two stages. In the initial stage, a structural model is developed that best fits the absorption, distribution and elimination of the drug and characterizes the population mean concentration-time curve. Systematic differences in the concentration-time profiles within subgroups of subjects are explored to identify covariates contributing to these differences. Covariates that are examined are those that typically influence absorption (age, race), volume of distribution (body weight, body surface area, plasma protein) and clearance (renal and liver function). The covariates are then used to plot concentration-time curves for individual patients. A plot of the estimated concentration-time curve for each individual is compared with the observed concentrations for the individual. Statistical approaches are used to bridge this difference – to understand the random variability (that cannot be accounted for by the covariates) in concentration-time profiles between subjects (inter-individual variability) and within subjects (inter-occasion variability) to further refine the concentration time curve for the individual. The residual unknown variability is likely to be small. NONMEM is the standard approach to PPK.
We acknowledge that we are physician scientists and may have oversimplified the methodology.
NONMEM
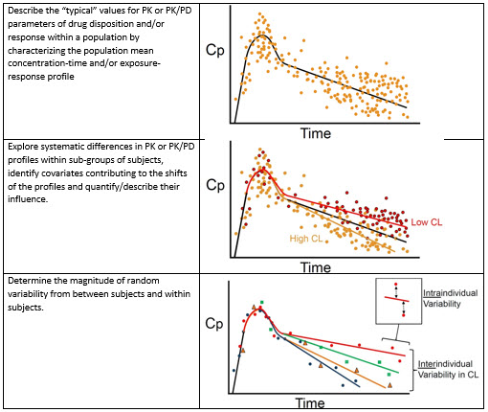
Image Credit: https://ddblog.labcorp.com/2018/07/population-pk-pd-analysis/
For more blogs, please visit: https://www.rxmd.com/insights